Not a COVID-19 Blog Post Part 3
Faster, Simpler, and Sustainable Integrations - Posted by Leon WardFaster, Simpler, and Sustainable Integrations: A sneak peek under the covers of ThreatQ’s integration capabilities
Following on to part one (Tips to Build Great Threat Tracking Dashboards), and part two (Rapid Response, Integration and Customization of New Threat Data Sources), let’s take a quick look at one of the technology foundations we built that enable them to be possible. This is going to get a little technical, but don’t worry, I’ll try to keep it at a high level focusing on the why behind the how. If you’re interested in the real technical details, we’ve got full documentation including tutorials in the ThreatQ Developer Guide, available on our customer Help Center.
For any platform or product to exist in our market category, the ability to rapidly integrate is critical for its own success, and for the success of its users. We’ve been told by customers that a key reason why we’ve been selected to be their preferred technology is the speed we’ve managed to respond to their deployment and integration needs and the depth of our integration capabilities. This is a core competency that we wanted to set the company for from close to day one, but it required some serious platform engineering investments to get where we are today.
We brought this problem to the table during a multi-day product and engineering design session back in ~2018 in Mt Airy MD. At the time ThreatQ had ~60 different python based “feed” integrations that all shared a lot of boilerplate code. It was painful to maintain, hard to build upon, complicated, and although it functioned, it was clearly slowing us down (both in platform performance, and ability to innovate). This is a perfect definition of tech debt. We also had a vision of how things could be done so much better, after all we’ve been living in the threat data integration world for years.
While a complete deep dive into how our solution to this problem works is beyond scope of this blog post, I’d like to provide a teaser to the technology under the covers by introducing a feed I created myself in response to some real customer COVID-19 requests. In total the complete feed ends up to be less than 50 “lines of code” (nice!) and supports the following key capabilities:
- GUI based drag-drop installation, enable/disable, and configuration functions
- Full (GUI based) access to the raw logs downloaded from each run (great for upstream troubleshooting if it’s ever required)
- Integrated health alerting (should something go wrong with data ingestion one day)
- Full audit controls on data ingested
- Optional TLP support for data sensitivity handling (not that it’s applicable here)
- Full control over data ingestion, mapping, and context over any and all of our object types (including any additional that a customer may have created)
Rather than require an author to create all of the functions/logic to support the above requirements, instead we create a special ThreatQ “CDF” (Configuration Driven Feed) file.
As I mentioned earlier, full documentation including multiple tutorials on how to build these feeds is available as part of the ThreatQ Developer Guide found on our customer Help Center in the Developer Resources tab. My “CDF” for this feed contains all of the information about how the following should be handled:
- Content download (including authentication),
- User configuration options, if there are any configuration choices to be made, for example how a mapping should function
- Data transformation and preprocessing (for example, converting XML content into iterable data objects)
- Parsing, mapping, and storing the data, along with context, formatting, relationships, TLP, statuses etc
- Sub-feeds to allow additional content fulfilment for data enrichment or full file content (like PDF reports, images, or malware sample downloads)
- Paging support, for consuming very large quantities of data
Additional elements, such as run schedule, default source TLP, expiration, data scoring, and default indicator status is handled outside of the feed in the ThreatQ GUI alongside all other sources.
Let’s look at some selected lines from my CDF to see how it all works. I’ve omitted additional content to keep things here as simple to read as possible, the full feed source can be downloaded from the ThreatQ Marketplace.
feeds:
  DomainTools COVID-19:
    category: OSINT
    source:
      http:
        url: !expr user_fields.url
    user_fields:
      - name: url
        label: URL to download file
        Default: <url value>
This above section defines the following:
- A name for this feed: “DomainTools COVID-19”. This will be used as the source identifier next to all the objects and context it creates.
- Categorization of where this feed should be displayed within the ThreatQ UI, OSINT, Commercial, Labs, and in the future additional classifications.
- Source: Where to find the data, here it’s specified as an HTTP url. Additional options can be provided here including how to handle TLS certs, content type, additional headers, authentication etc. This example, uses a URL that is set in the ThreatQ GUI
- A GUI user configuration field to allow a user to specify or change the URL of where to download the content from. Note I’ve omitted the actual <url value> that is provided as a default here.
The DomainTools COVID-19 data is provided as an easy to parse tab delimited file with three columns (find more info here). The domain name (fqdn), the date created (created_date), and a DomainTools provided risk score (risk_score).
All data after being downloaded will need some form of additional pre-processing, and depending on the data formats, the quantity and complexity can vary. This is handled by applying a series of filters to the data in order. Again here I’ve omitted some additional bits of data to focus on the key interesting elements. This section is defined as “filters”, and is pretty straightforward to understand.
    filters:
      - gunzip
      - str
      - split-lines
      - iterate
      - parse-csv: excel-tab
      - map-items: ['fqdn', 'create_date', 'risk_score']
- The original content is a gzip compressed, therefore gunzip will decompress it
- The content is then typecasted to a string
- Each entry from this DomainTools data is on a different line, therefore we split at the line break to mark a single record
- Iterate over each line (with each line being a single record)
- The format of each line, is a tab delimited “CSV”, so it’s converted into a list
- Each element of the list is mapped to a key, so the first element is the “fqdn”
After the filters have completed, we’re left with a series of objects like this being presented to a report phase. Note that I’ve omitted the actual malicious domain.
    {
        "create_date": "2020-03-13",
        "fqdn": "<some malicious fqdn>",
        "risk_score": "99",
    },
Next up is a report phase, where the feed author is able to decide what objects are reported by the feed, and with what context. For this simple dataset, it’s pretty easy to follow, however it’s possible to create and parse much much more sophisticated datasets.
    report:
      attribute-sets:
        default:
          - name: Risk Score
            value: !expr data.risk_score
          - name: First Seen
            value: !expr data.create_date

      indicator-sets:
        default:
          attribute-sets:
            - default
          indicators:
            - type: FQDN
              value: !expr data.fqdn
Above, I’m choosing to report the risk_score and first_seen context as attributes with the names Risk Score and First Seen.
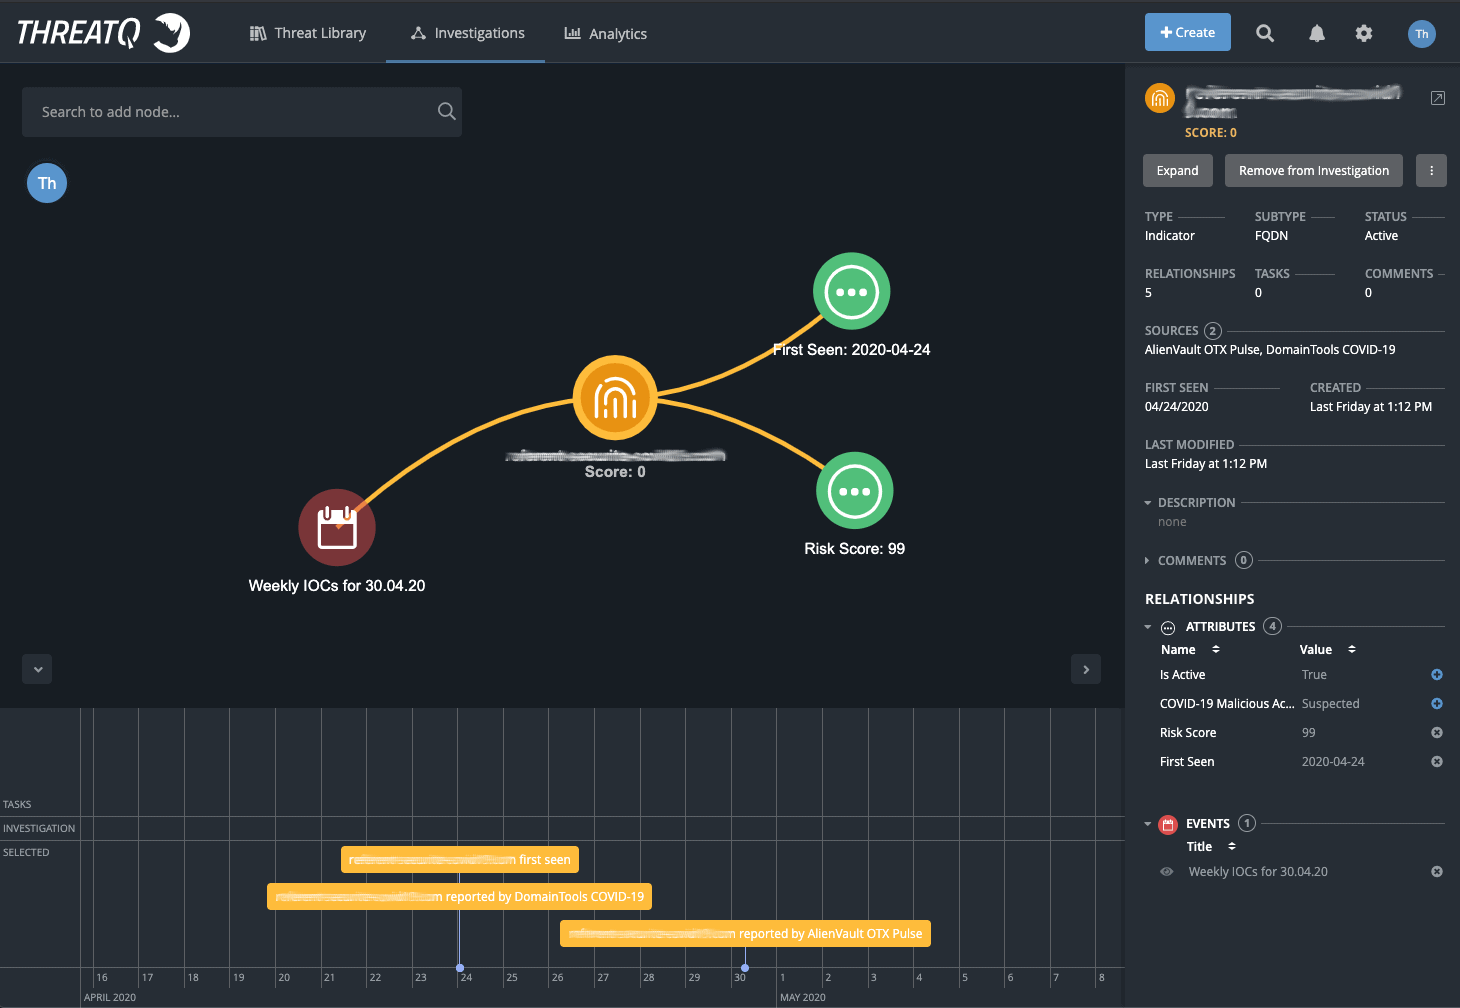
When the data is ingested into ThreatQ, we’ll see the indicator objects, along with the context reported. This data is aggregated into the Threat Library, so when this object is viewed, it’s displayed alongside all of the other information about this object that is reported from all other sources, as you can see below.
The key benefits of being able to build data integrations like this are:
- Faster development
- Improved readability and simplicity
- Standardization of key functions
- Testability
- Easier lifecycle management
Over the last few months we’ve completed a migration of all of those legacy feeds I mentioned before over to this new framework. Taking this approach to the problem has allowed us to pay off that tech debt, while increasing our integration agility, and speed of execution. If you’re interested in seeing another example, but in more depth, a very smart colleague of mine talks you through an example in this video. Check it out!

0 Comments