Not a COVID-19 Blog Post Part 1
Top 5 Tips to Build Great Threat Tracking Dashboards in ThreatQ - Posted by Leon WardSociety is experiencing a phase of extreme change with many people being introduced to new ways of working, communicating, and conducting business. These changes also bring with them exposure to new cybersecurity risks that threat actors choose to exploit, along with novel lures that pull on our fears and inquisitive nature.
Driven by this situation, we’ve received questions from customers seeking our advice on two things:
- How best to use ThreatQ to implement dashboards to track COVID-19 related threat activity, along with its potential impact within their organization (covered in this blog post).
- How to quickly consume and integrate with the wide variety of newly available “OSINT” threat data sources that provide context and information about campaigns and adversaries leveraging it as a lure (covered in part 2)
As we were compiling the advice for some, we thought it may help others… so read on for the first part: Top 5 tips to build great threat tracking dashboards.
Before we go any further, it’s important to understand that this information is not specific to COVID-19, so if you’re struggling with a radically different form of threat in the future (say some new high profile wormable 0day or a ransomware campaign with a global impact, the advice here should still hold up.)
Our customers connect to a wide variety of different security operations tools and commercial threat intelligence sources, therefore to provide some advice and suggestions that would be applicable to everyone, I’m choosing to use generally available OSINT data. More information about the sources will be available in part two, since we will be creating some of the feeds especially for this threat. The approach and example searches I use should however be valid and useful examples across the majority of data commercial sources and defence products you may be consuming.
My top 5 tips to build great dashboards are:
- Define the requirements for your dashboard before you build it, understand what you want it to represent, and choose the good labels
- Research new threat data sources that may help you
- Understand the data in your system, and how to group it to represent your needs
- Understand the needs of the consumers of this data (operational, management, intelligence analysts etc)
- Share it with the right audience
To jump right to the conclusion, here is the end result I’ve put together that met my requirements. Note that it blends together different related needs from different users into one display.
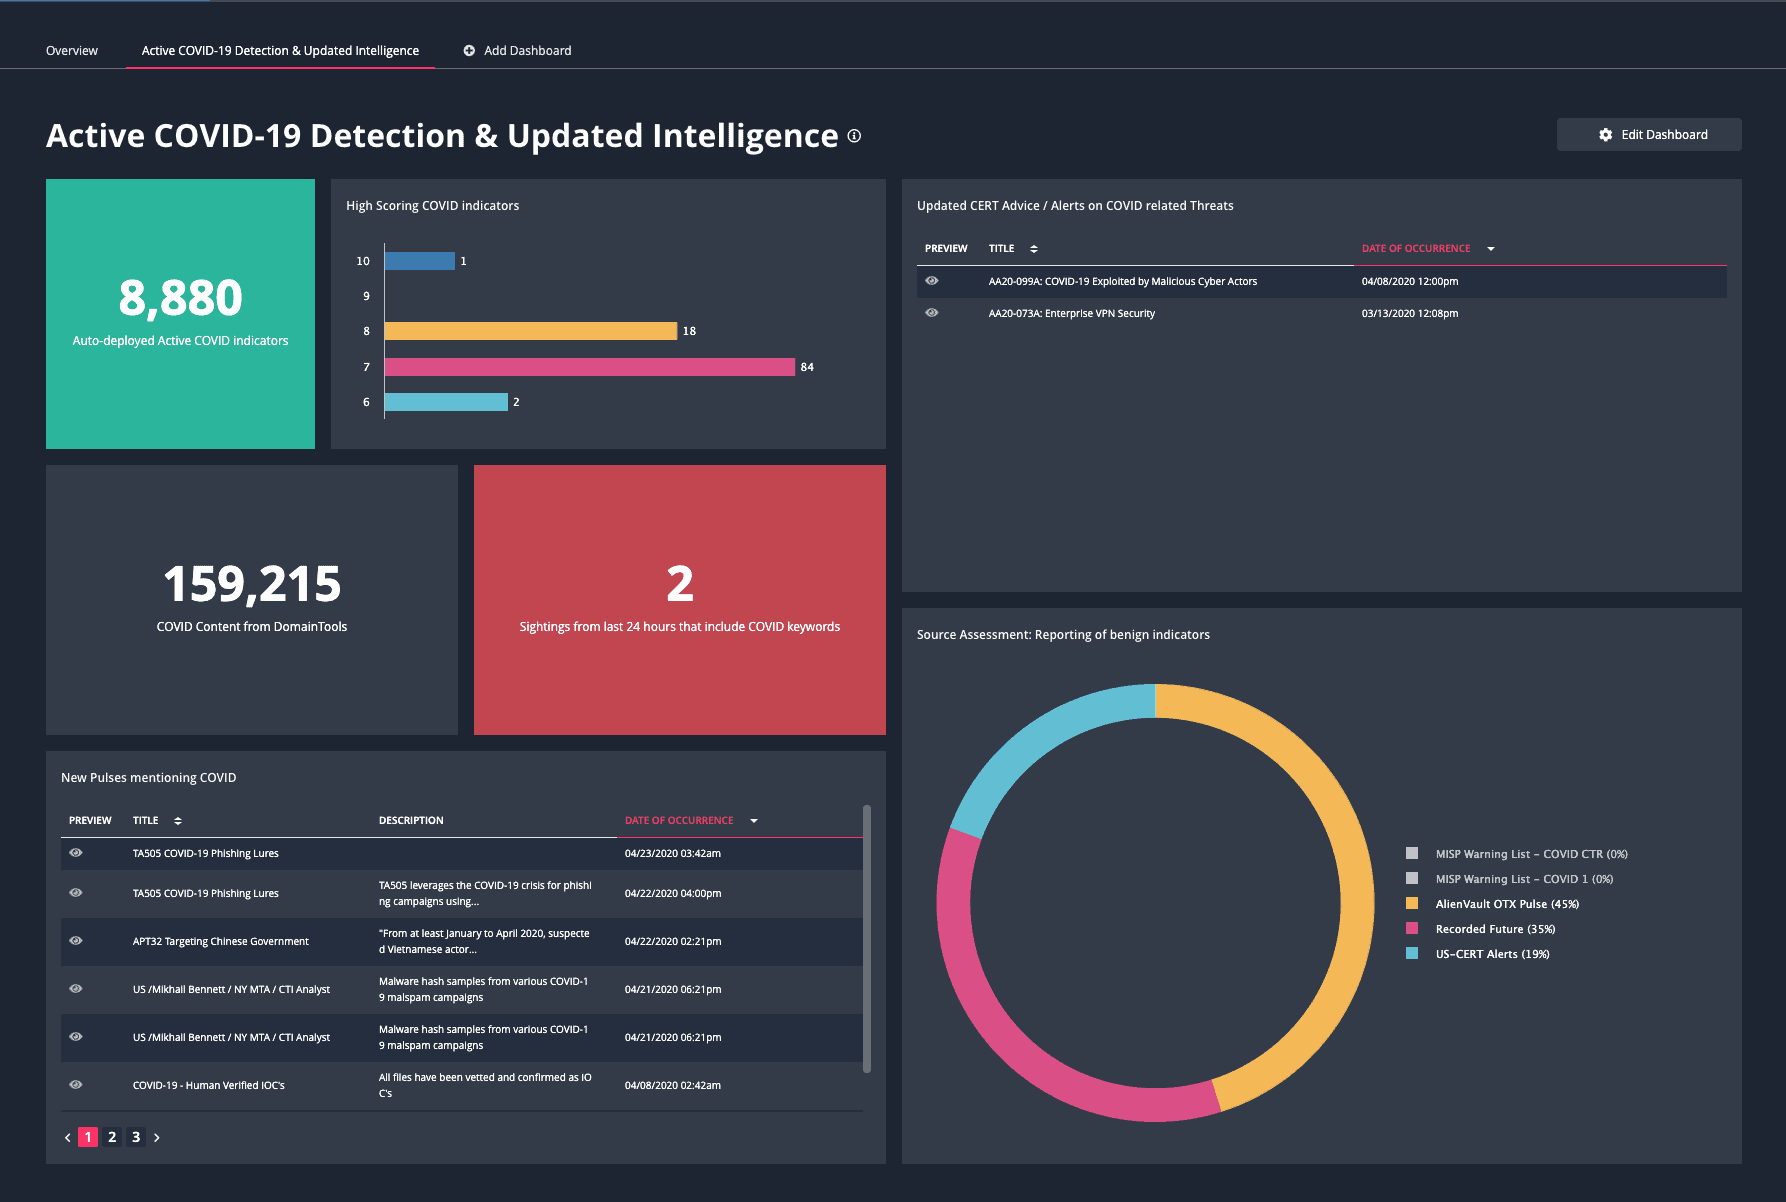
Let’s look at each widget in turn starting at the top left.
Auto-deployed (Active) COVID Indicators: Count widget with description and color formatting applied
In my system I have scoring enabled and I’m using it to partially determine what indicators are automatically being operationalized by ThreatQ into my defenses. If any indicator meets the criteria of having a status of Active, a score above a threshold, and in some cases additional criteria, it appears in my automatic exports. Of that overall dataset, only a minority of the content is currently COVID related, this widget tracks that content by applying covid keyword searches in addition.
High Scoring COVID Indicators (Horizontal Bar)
To better understand the scoring behind these COVID indicators, I’m including a bar chart for the most high scoring content. This is also a useful jump off point that allows me to dive into the most interesting indicator content with a single click.
New Pulses mentioning COVID: Table with selected columns on display, ordered by date)
AlienVault OTX Pulses provide a great source of OSINT data from a community of contributors. Since my demo dashboard is staying away from commercial content, I’m using this table as an example of how this content can be displayed with quick links for preview, and constrained to only focus on content where specific keywords are included. The same search logic I use here can be applied to completed intelligence reports in PDF form that are provided by some commercial providers.
Source Assessment: Reporting of benign indicators (Pie Chart)
Many external data sources provide raw information from communities sharing information for the benefits of others. It’s common to have benign/trusted domains, URLs etc appear on these from time to time. Note that It’s important to never judge the value of an intelligence source on this aspect… but that’s a subject for another time. I am mitigating this risk with a very useful set of “Warning Lists” provided by some MISP users, including a very valuable one from the Cyber Threat Coalition. Links below.
Updated CERT Advice on COVID Threats: Table, with selected columns, sorted by date
This is a good example of using a table to highlight events based on key search criteria. It’s possible to add additional tracking data such as a reviewed attribute to help identify what events have been reviewed.
COVID Content From DomainTools
I’m using this particular vendor example of publicly published COVID related content since it’s been a common conversation point with customers over recent days. More information on this feed is covered later in this post.
Sightings in last 24 hours that include COVID keywords
I’ve got a search that is monitoring any sighting events that include COVID keywords. This is a good example of being able to focus on security operations data with an intelligence motivation. It’s also a good opportunity for me to call out a recently added capability of being able to use relationship context in searches. If it goes above 0, it turns red.
So let’s dive into my top tips on designing a dashboard.
Define the requirements
Understanding what you need to achieve with your dashboard is critical to keep it on mission. The title is a good way to capture this since it’s front and center to the person looking at it. So don’t give it a generic title like “COVID Data”. If you’re fighting to come up with one name that represents all of the information, perhaps it’s because you’re blending use cases together and a second dashboard might be needed.
Decent examples would include:
- Recently updated threat advice on COVID 19
- Active security incidents involving COVID 19 lures
Bad examples would be:
- COVID Data
- COVID Dashboard
For my dashboard, I’m choosing to combine two use related cases in one. “Active COVID-19 Detection & Updated Intelligence”
Research new threat specific data sources
I’m sure you’ve been inundated with lists of new sources of COVID-19 related threat data, but if you’ve not looked at the information yet from CISA & NCSC (US Cybersecurity and Infrastructure Security Agency & UK National Cyber Security Center), it’s a good idea to. They have jointly provided a decent package of COVID-19 related indicators in STIX format (that imports perfectly into ThreatQ) along with a decent list of additional sources that can be investigated. We’ll look at some of those sources in detail in part 2.

It’s also worth noting that the above alert itself along with all the links was automatically created in ThreatQ using the US CERT NCAS integration (included in the resources links section below). This is a perfect example of the type of data you want to be displayed on your dashboard when it’s published.
One very useful feature of ThreatQ is that a user can add context during the import of data. As you import and parse the content of PDF reports that contain threat content, you have the opportunity to add attributes and relationships. I’m using an attribute key of “COVID-19 Malicious Activity” to link the content back to my motivation of importing the data. That has enabled the display of the much of the data in my dashboard
Share it!
While this may sound like an obvious step, unless your audience knows that there is a new resource to use, they won’t use it.
- Ensure your sharing / access controls on the dashboard are set to include the users with whom you want to share the data.
- Email them a link to the dashboard.
We improved the user experience of sending dashboards links in v4.35 to better enable this use case. If you now send a link to your dashboard URL to a user that has access to it, after clicking the link, they will have the dashboard immediately presented to them – well either that or a friendly access denied message, if the user doesn’t have access rights.

0 Comments